

Sound investments
don't happen alone
Find your crew, build teams, compete in VS MODE, and identify investment trends in our evergrowing investment ecosystem. You aren't on an island anymore, and our community is here to help you make informed decisions in a complex world.


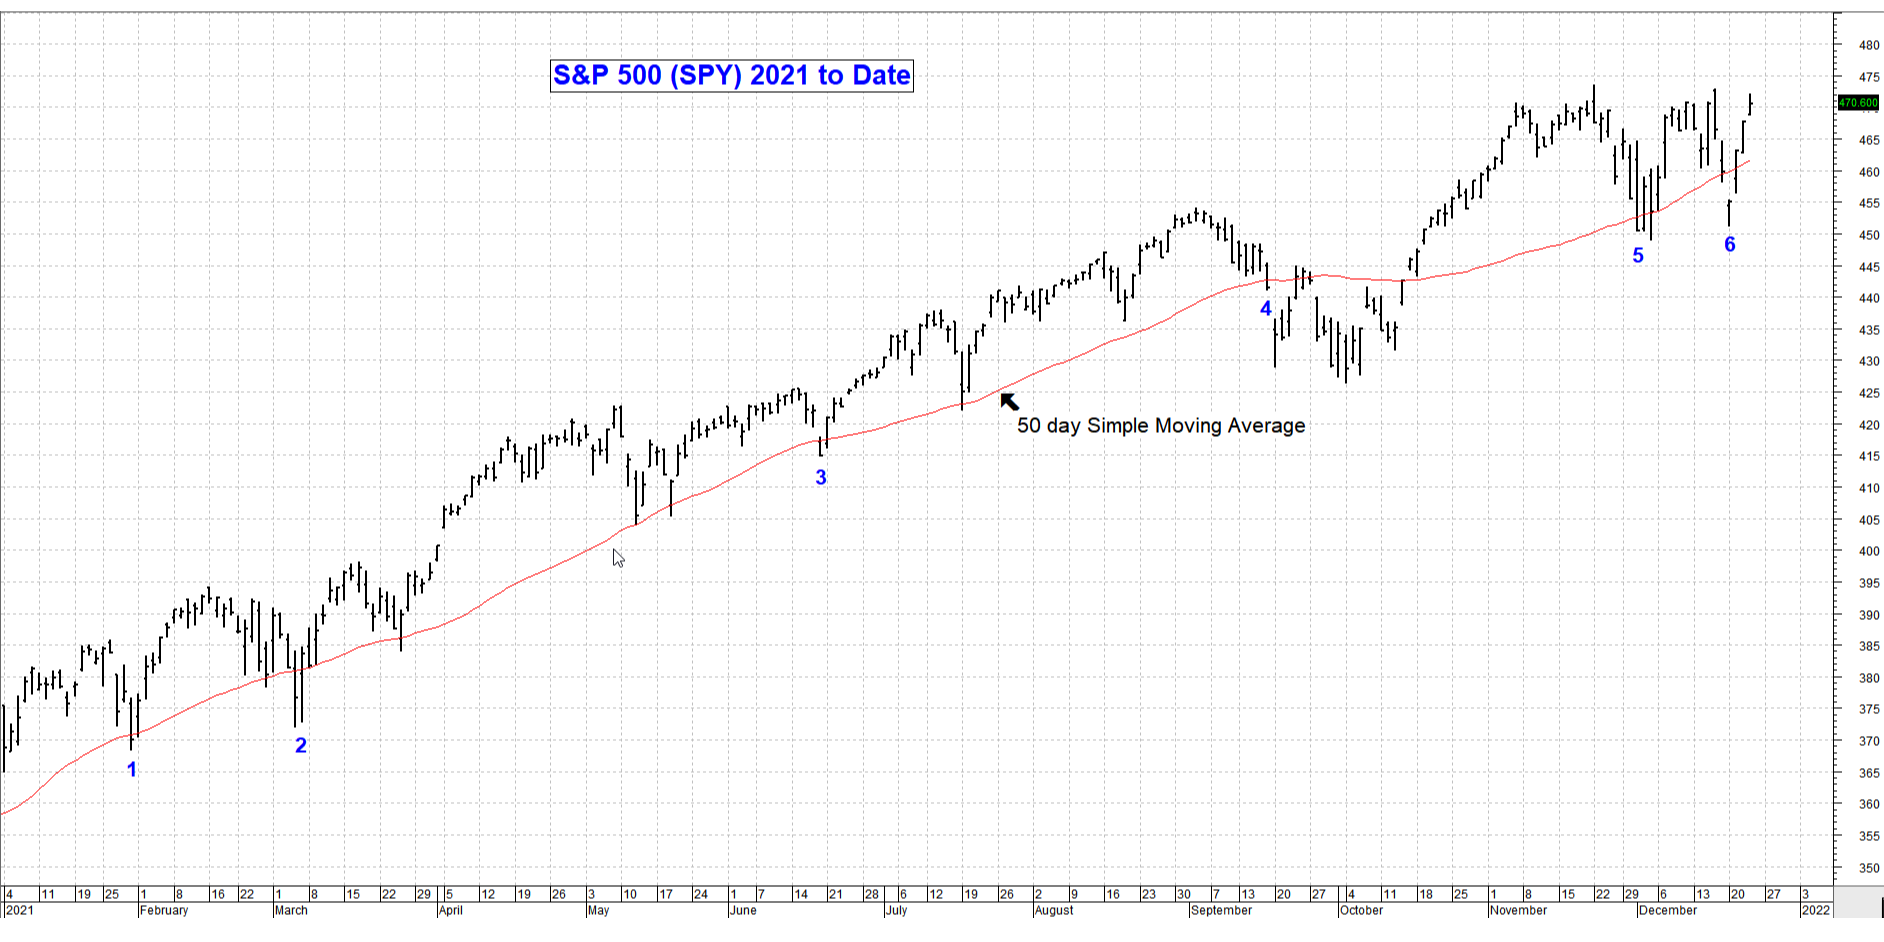


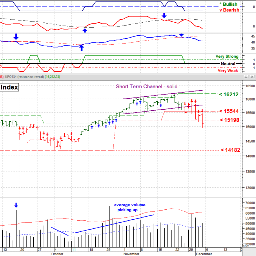


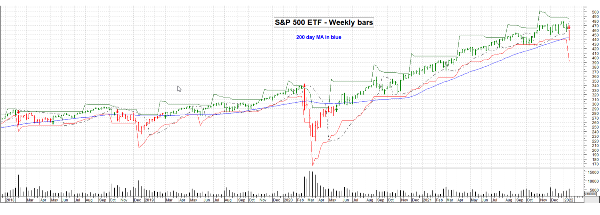
But let’s keep things in perspective. The average drawdown in a “normal market” (i.e. between 1989 and 1999) is about 10%; we are there now. Also, a drop to around the 200 day moving average is also “typical”; see chart below . . . we’re there now.
This is a chart of the weekly S&P 500. That gives us some perspective. But make no mistake. Holding the line here is Bullish, a flush through is Bearish. With the overall economy is pretty good shape, I’m thinking this is just a normal correction and perhaps a buying opportunity. We’ll see, and it won’t take long.
More discussion at: www.special-risk.net . chart used with permission; MetaStock.