

Sound investments
don't happen alone
Find your crew, build teams, compete in VS MODE, and identify investment trends in our evergrowing investment ecosystem. You aren't on an island anymore, and our community is here to help you make informed decisions in a complex world.


May 20, 20200 – Just when you thought all is lost . . . comes a (possible) recovery. That’s my feeling right now that Friday was a possible short term capitulation day in the immediate term. Market breath is “so bad, that it’s good”; in that so many stocks are washed out that we’re due for a surprise rally next week. Now that may only be a short term rally, we’ll have to gauge its strength and breath IF it does come but I’m seeing early signs of divergences in a number of indicators. My concern is it could just be a brief “got-sha” rally to lure folks back in before we head back down. That would be more typical than not.
I note that the “Money Flow” indicator is positive and just average market volume. A true capitulation sell off would be on high volume, but Friday was options expiration day with many Puts expiring so that could mask volume in the background since futures are involved with many options writers.
One thing that doesn’t help is that a couple of large hedge funds are calling it quits and now must liquidate shares to redeem clients back into cash. Also a sign of extremes are the prices of wheat and corn. They are at / near all-time highs due to the Ukraine war; it’s not just oil (Thanks Vladimir).
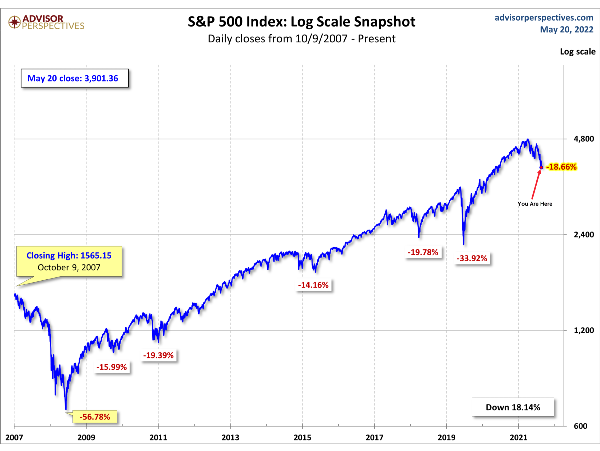
To give us an idea of where we are in the typical stock market cycle I borrowed this chart from Doug Short at Advisor Perspectives. Have a good week ! ............. Tom ...............
More discussion at www.special-risk.net . Price chart by MetaStock; pie chart & table by www.HighGrowthStock.com & Advisor Perspectives.com. Used with permission.