Introduction
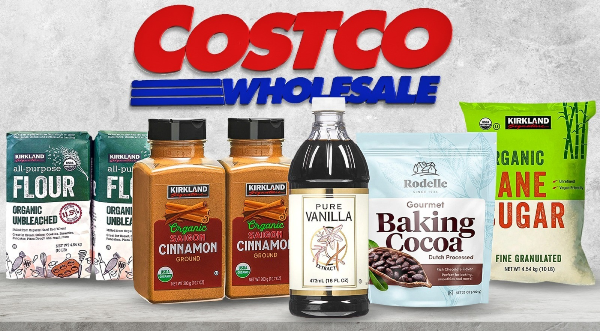
Costco Wholesale Corporation (NASDAQ: COST) has recently experienced a notable decline in its stock price, dropping over 8% in the last five days. This downturn comes amid market uncertainty and tariff concerns, leading to Costco underperforming compared to the broader S&P 500. With Costco trading at $951.9 per share, investors are questioning whether this dip presents a buying opportunity.
Costco's Key Financial Metrics
A deeper dive into Costco's financials reveals crucial insights:
- Market Cap: $430 billion
- PE Ratio: 55 (Above market average)
- Earnings Per Share (EPS): $7.13
- Beta: 0.82 (Indicating lower volatility)
- Dividend Yield: 0.4% ($4.59 per share)
- Free Cash Flow Payout Ratio: 40%
Despite recent volatility, analysts continue to recommend Costco as a buy, setting a target price of $1,062—a price Costco previously reached just weeks ago.
Revenue and Profitability Trends
Costco’s trailing twelve-month revenue stands at $258 billion, marking consistent year-over-year growth. Despite external economic pressures, Costco has demonstrated robust profitability, achieving $7.58 billion in net income with a 15% compound annual growth rate (CAGR).
However, free cash flow has dipped to $5 billion, largely due to increased capital expenditures, a trend reflected in the company’s operating cash flow. Costco has also maintained flat outstanding shares since 2013, opting against stock buybacks or additional issuances.
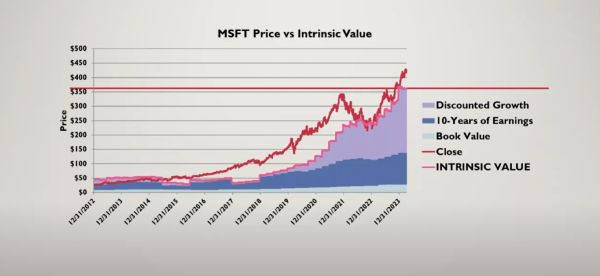
Stock Valuation: Discounted Cash Flow Model
Using a discounted free cash flow (DCF) model, Costco’s intrinsic value is calculated at $366 per share, significantly lower than the current stock price. The dividend discount model similarly suggests that Costco may be overvalued, given its relatively low dividend yield and a high bond yield environment.
Comparable Company Analysis
Comparing Costco with competitors like Walmart (NYSE: WMT), Target (NYSE: TGT), and BJ’s Wholesale (NYSE: BJ) offers further perspective:
| Company |
Revenue |
Net Income |
PE Ratio |
Revenue Growth Rate |
| Costco |
$258B |
$7.58B |
55 |
Highest Among Peers |
| Walmart |
$620B |
$23B |
30 |
Moderate |
| Target |
$107B |
$3.3B |
25 |
Lower than Costco |
| BJ’s |
$22B |
$0.9B |
22 |
Lower than Costco |
Costco maintains the highest revenue growth rate among its peers, justifying its premium valuation. However, its price-to-earnings-growth (PEG) ratio of 5 suggests it may be expensive compared to historic norms.
Conclusion: Should You Buy Costco Stock?
Historically, Costco has outperformed the S&P 500, gaining over 200% in the past five years. Even with the current pullback, its long-term growth trajectory remains strong.
However, given the high valuation, investors may want to wait for a more attractive entry point before adding Costco to their portfolios. For long-term investors, Costco’s revenue growth, profitability, and stability make it a strong contender for sustained performance.
What do you think? Is Costco a buy at current levels, or should investors wait for further discounts? Let’s discuss!
https://youtu.be/O20qGawpDFw?si=eDHwZInwH4ksSYOX


Introduction
Costco Wholesale Corporation (NASDAQ: COST) has recently experienced a notable decline in its stock price, dropping over 8% in the last five days. This downturn comes amid market uncertainty and tariff concerns, leading to Costco underperforming compared to the broader S&P 500. With Costco trading at $951.9 per share, investors are questioning whether this dip presents a buying opportunity.
Costco's Key Financial Metrics
A deeper dive into Costco's financials reveals crucial insights:
Despite recent volatility, analysts continue to recommend Costco as a buy, setting a target price of $1,062—a price Costco previously reached just weeks ago.
Revenue and Profitability Trends
Costco’s trailing twelve-month revenue stands at $258 billion, marking consistent year-over-year growth. Despite external economic pressures, Costco has demonstrated robust profitability, achieving $7.58 billion in net income with a 15% compound annual growth rate (CAGR).
However, free cash flow has dipped to $5 billion, largely due to increased capital expenditures, a trend reflected in the company’s operating cash flow. Costco has also maintained flat outstanding shares since 2013, opting against stock buybacks or additional issuances.
Stock Valuation: Discounted Cash Flow Model
Using a discounted free cash flow (DCF) model, Costco’s intrinsic value is calculated at $366 per share, significantly lower than the current stock price. The dividend discount model similarly suggests that Costco may be overvalued, given its relatively low dividend yield and a high bond yield environment.
Comparable Company Analysis
Comparing Costco with competitors like Walmart (NYSE: WMT), Target (NYSE: TGT), and BJ’s Wholesale (NYSE: BJ) offers further perspective:
Costco maintains the highest revenue growth rate among its peers, justifying its premium valuation. However, its price-to-earnings-growth (PEG) ratio of 5 suggests it may be expensive compared to historic norms.
Conclusion: Should You Buy Costco Stock?
Historically, Costco has outperformed the S&P 500, gaining over 200% in the past five years. Even with the current pullback, its long-term growth trajectory remains strong.
However, given the high valuation, investors may want to wait for a more attractive entry point before adding Costco to their portfolios. For long-term investors, Costco’s revenue growth, profitability, and stability make it a strong contender for sustained performance.
What do you think? Is Costco a buy at current levels, or should investors wait for further discounts? Let’s discuss!
https://youtu.be/O20qGawpDFw?si=eDHwZInwH4ksSYOX